Guide to NOAA Buoy Reports for iOS & Android
Thank you for using NOAA Buoy Reports™. This guide helps you get the most out of NOAA Buoy Reports' features.
Data courtesy of National Data Buoy Center (NDBC), and the National Hurricane Center (NHC), both divisions of NOAA and the National Weather Service. The automated data retrieved may not be manually quality-controlled, so use discretion. Please refer to your local NWS office for official information.
Reports may be delayed a little as NDBC receives and processes data. Map data, Favorites, and Buoy conditions and graphs can be refreshed by clicking the refresh button in the upper right hand corner. Not all stations have all types of observations available at all times. In fact, most stations only support 1 or 2 types of readings. Individual stations may be occasionally taken offline due to maintenance, quality control, or other reasons.
What is a Buoy?
For the purposes of this app, a "Buoy" may be floating at sea (usually anchored), a lighthouse, or a near-shore weather station designed to capture ocean conditions. For most buoys, you can retrieve a history of their conditions. Quick Tip: It is possible that a buoy may not report some values (ie Wave Height) in their most recent observation, but it may available in a recent past observation if you view its history plot.
What is a Ship?
The ships that you can find reporting their observations in this app are mostly U.S. Voluntary Observing Ship participants. They report anonymously due to security reasons, and their positions are approximate. Since they cannot be individually identified, you cannot get historical data for them, nor favorite them. They are useful for getting observations in out-of-the-way places. This app will show ship observations from the last hour or so. A ship you can get readings from now, might not be there later. After your free preview period, ship observations require a Premium Upgrade.
What is a Storm?
For the purposes of this app, a "Storm" is tropical weather system of concern by the National Hurricane Center. Generally, only tropical or sub-tropical storms in the Atlantic, Eastern Pacific, and Central Pacific are reported. Storms may be classified as depressions, cyclones, storms, remnants, or hurricanes. This app will usually report their maximum sustained winds and minimum pressure. For additional information about specific storms, please consult your favorite weather app.
Using the Map
From the map tab you can see where ships and buoys are located. You can get a recent station reading by simply tapping a station symbol, and then a detailed summary or buoy conditions graph by tapping in the report "bubble".
NOAA Buoy Reports will attempt to refresh map and favorites data whenever the app is opened. You may refresh the data manually at any time by tapping the Refresh icon in the upper right.
You can go to your current location by tapping the "current location" arrow icon in the upper right corner. To conserve your device's battery life this app attempts to use cellular (not GPS) location data when available, and turns off any location services it is using when it no longer needs them.
The stations mapped are those which NDBC is currently making available in a format that NOAA Buoy Reports can use, with over 1000 buoys at last count, and over 200 ships. There are buoys which are not integrated into the NDBC network. Stations are sometimes added or dropped as funding and priorities change, or buoys are temporarily or seasonally (especially the Great Lakes!) removed for service.
The map style can be changed between Standard, Hybrid, and Satellite via Settings.
Buoy Symbols
The buoy symbol used on the search tab, favorites tab, and the Today widget can give you a clue to the current buoy conditions.


Please remember that most buoys are not equipped to measure all things. It could be blowing 100 knots at a certain buoy, but it may not show the windy symbol because the buoy does not have wind measurement devices (or they were blown off!).
Using Search
You can search for buoys individually if you know their 5 digit NOAA Station ID or part of their official description. Search is not case sensitive.
Using Favorites
Buoys added to your favorites list will allow to you to review recent conditions for them at a glance. Tapping a favorite buoy will display the full buoy report.
You can add stations to your favorites by tapping the star icon  on the buoy summary on the map view, or on the bottom of the screen on the full report or the graphs.
Users who have upgraded to Premium can have unlimited stations in their favorites. Other users are limited to 1. Premium users may also rename their favorites at time of creation, or by tapping their Favorite's name when in Edit mode on the Favorites List. A Favorite's name is limited to 16 characters for optimum display flexibility.
Units
Via Settings, you can change the unit types you would like to use between English and Metric.
Using the Graphs
From the Map or the Favorites tabs, you can get a detailed buoy conditions graph on the recent history for the station.
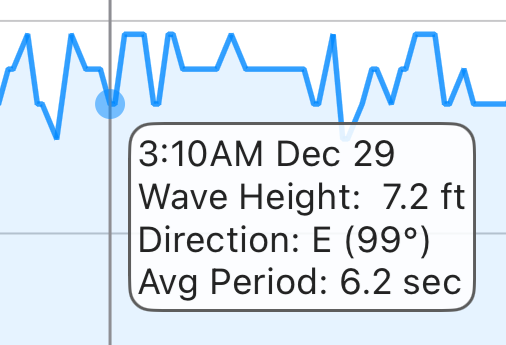
To get fine-tuned graph readings, including wind or wave direction, you can "touch and hold" on the graph with your finger then slide your finger along the graph for a detailed reading via the "bubble text" for a given time.
You can also pan left, right, up, and down with your finger, or even zoom in and out with pinch gestures.
If you prefer to see graph data in metric or English units, you may change them via Settings
Upon presentation the graph will show approximately the last 12 hours of history. Please note that history durations vary by station. Premium users will be able to pan beyond the 12 hour limits if the data is available. Buoys maintained by the USA usually offer 45 days of history. Buoys maintained by other authorities vary widely.
To share an image of the buoy conditions graph via EMail, Message, Airdrop, Facebook, Twitter, etc., or to save it for off-line viewing, click the "Action" tool bar button, and select the appropriate action.
Sharing quick tip: You may highlight a particular time via the "touch and hold" method, and the "bubble" label will be included in the image.
Graph Types
NOAA Buoy Reports supports 5 graph types, some of which can include more than one item. Please remember that most buoys only record a few measurement types. None include all.
- Wind - Average and gusts dependent on station. Tap and hold on the graph to get the wind direction.
- Waves - Wave height. Tap and hold on the graph to get dominant wave period and wave direction.
- Temperature - Air, water, and dew point.
- Pressure - barometric pressure.
- Visibility - distance you can see. Not many stations support this.
Using the Widget
NOAA Buoy Reports includes widgets for iOS and Android.
Depending upon the size of widget you selected, NOAA Buoy Reports will show up to your first nine favorite locations (don't forget you can change the order of your favorites in the app's Favorites screen). You can go straight to the full buoy report by simply tapping the reading.
Premium Upgrade
While we are happy if people find the "Free" app useful, it doesn't buy us any coffee. Please support this app and its continuing improvements by selecting "Upgrade To Premium" via settings. Premium users will be able to use unlimited favorites, view graph observation history up to 45 days old, view Ship observations, and be "ad free". Plus some other stuff.
About Us
Juggernaut Technology is a small, independent software company with over 20 years of experience. We are privately owned and self-funded, with no private equity or venture capital backing, allowing us to focus on long-term quality, reliability, and direct relationships with our users.
For more information about this app or other projects, please visit us at www.Juggernaut-Tech.com.
We would appreciate your feedback! Please email us at info@NOAABuoyReports.com if you have any complaints, suggestions, or comments.
Download for Free Today!
Juggernaut Technology, Inc. is not associated with nor endorsed by NDBC, NHC, NOAA, or any other government agency.
Copyright 2015 - Juggernaut Technology, Inc. All Rights Reserved.
Quickly get the latest observations, recent history, and forecasts for most of the rivers, streams, and waterways that NOAA actively monitors in the USA with Rivercast. Check out our great map interface and interactive graphs!

Are you wiring new systems or rewiring old on your boat, RV, or car? Try WireSizer, our ABYC conforming wire gauge and voltage drop calculator!
Do you ever find yourself walking down a dock, scratching your head wondering, "Who made that boat?" Try HINSearchPlus, our Hull Identification Number lookup and more App!